Food detail / Source: USDA
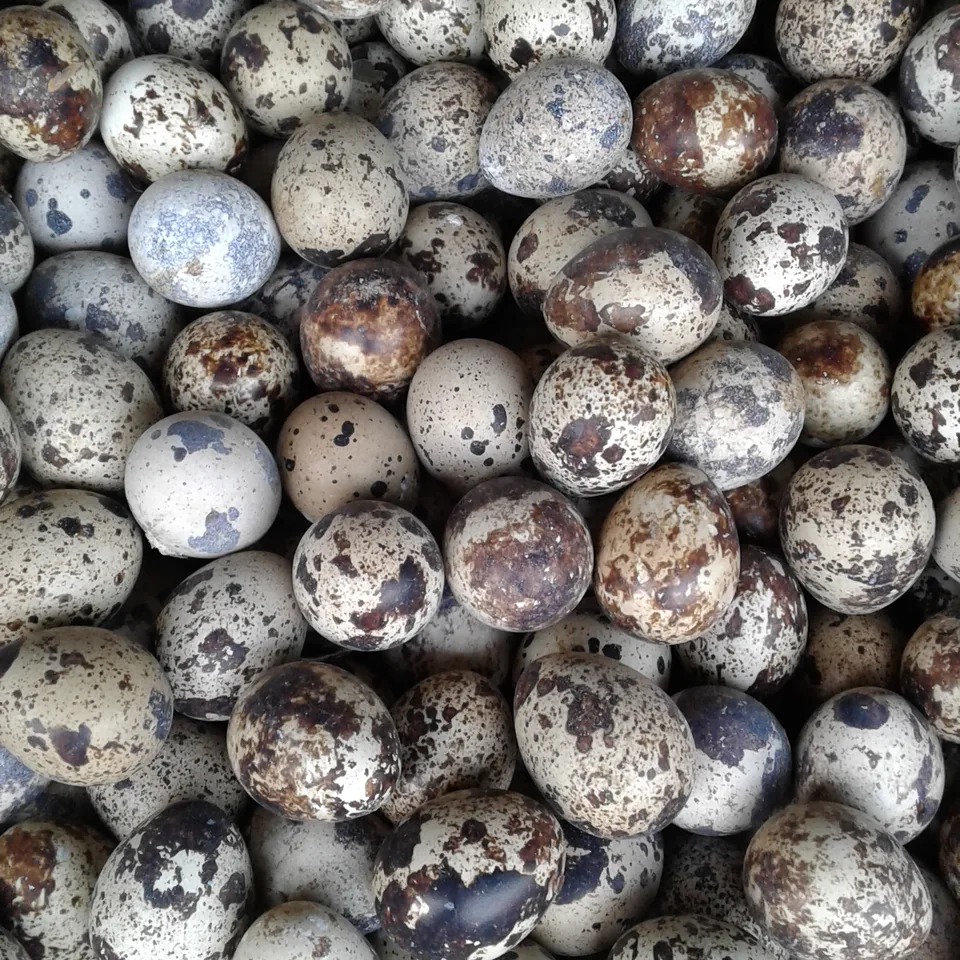
Quail egg
Category: Meat, fish, seafood or egg
Preparation: Egg, quail, whole, fresh, raw, exactly as identified by USDA.
Commonly sold in: Latin America · North America · Europe
Loading account…
Rank per 100 g · #1 = highest amount, not a health score. Ranks update with the published catalog.
158.0 kcal
13.1 g
0.4 g
11.1 g
0.0 g
74.3 g
64.0 mg
3.6 mg
13.0 mg
226.0 mg
132.0 mg
141.0 mg
0.0 mg
0.1 mg
0.8 mg
0.1 mg
0.1 mg
66.0 µg
263.4 mg
1.6 µg
156.0 µg
1.1 mg
55.0 IU
1.4 µg
0.3 µg
844.0 mg
USDA composition per 100 g for this preparation. Missing values and results below quantification limits remain unavailable for arithmetic; see USDA for the original limits. These data do not establish a food-specific health benefit.
Reported amino acids
Amounts follow the selected portion. Missing values are not reported, never assumed to be zero.
298 foods · per 100 g
Where does this food rank?
Position 1 has the highest amount. All published foods with data for the same nutrient form are compared using compatible units. Rankings refresh when catalog changes are published; a high position does not mean a food is healthier.
229 nutrients · page 1 of 20
- Not reported1 with comparable data
297 not reported · 0 incompatible units
- Not reported2 with comparable data
296 not reported · 0 incompatible units
Alanine
#570.762 g198 with comparable data100 not reported · 0 incompatible units
Alcohol, ethyl
#1520 g203 with comparable data95 not reported · 0 incompatible units
- Not reported0 with comparable data
298 not reported · 0 incompatible units
Arginine
#640.835 g203 with comparable data95 not reported · 0 incompatible units
Ash
#1441.1 g297 with comparable data1 not reported · 0 incompatible units
- 1.294 g199 with comparable data
99 not reported · 0 incompatible units
- Not reported2 with comparable data
296 not reported · 0 incompatible units
- Not reported0 with comparable data
298 not reported · 0 incompatible units
- Not reported10 with comparable data
288 not reported · 0 incompatible units
- Not reported75 with comparable data
223 not reported · 0 incompatible units
Unreported values never count as zero. Ties use the stable food identifier. Bars show relative position, not a percentage of recommended intake.

Reference photograph; not the sample analyzed by USDA.