Food detail / Source: USDA
Blueberries
Category: Fruit
Preparation: Blueberries, raw, exactly as identified by USDA.
Loading account…
Portion
Adjust the amount
Rank per 100 g · #1 = highest amount, not a health score. Ranks update with the published catalog.
57.4 kcal
0.7 g
14.6 g
0.3 g
Not reported
84.2 g
11.7 mg
Not reported
6.2 mg
13.0 mg
85.6 mg
Not reported
8.1 mg
USDA composition per 100 g for this preparation. Missing values and results below quantification limits remain unavailable for arithmetic; see USDA for the original limits. These data do not establish a food-specific health benefit.
206 foods · per 100 g
Where does this food rank?
Position 1 has the highest amount. All published foods with data for the same nutrient form are compared using compatible units. Rankings refresh when catalog changes are published; a high position does not mean a food is healthier.
218 nutrients · page 1 of 19
- Not reported1 with comparable data
205 not reported · 0 incompatible units
- Not reported2 with comparable data
204 not reported · 0 incompatible units
- Not reported144 with comparable data
62 not reported · 0 incompatible units
- Not reported139 with comparable data
67 not reported · 0 incompatible units
- Not reported0 with comparable data
206 not reported · 0 incompatible units
- Not reported148 with comparable data
58 not reported · 0 incompatible units
Ash
#1990.2288 g205 with comparable data1 not reported · 0 incompatible units
- Not reported145 with comparable data
61 not reported · 0 incompatible units
- Not reported1 with comparable data
205 not reported · 0 incompatible units
- Not reported8 with comparable data
198 not reported · 0 incompatible units
- Not reported60 with comparable data
146 not reported · 0 incompatible units
- Not reported10 with comparable data
196 not reported · 0 incompatible units
Unreported values never count as zero. Ties use the stable food identifier. Bars show relative position, not a percentage of recommended intake.
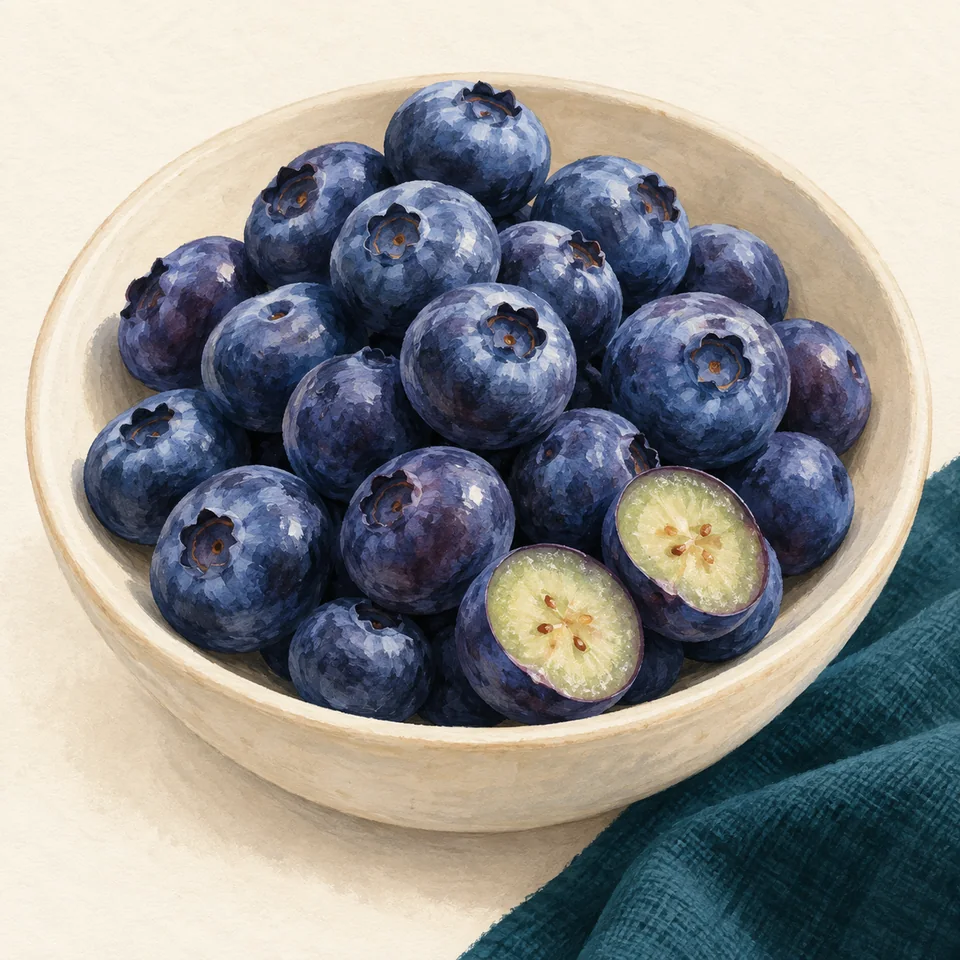
Reference photograph; not the sample analyzed by USDA.